Figure 1
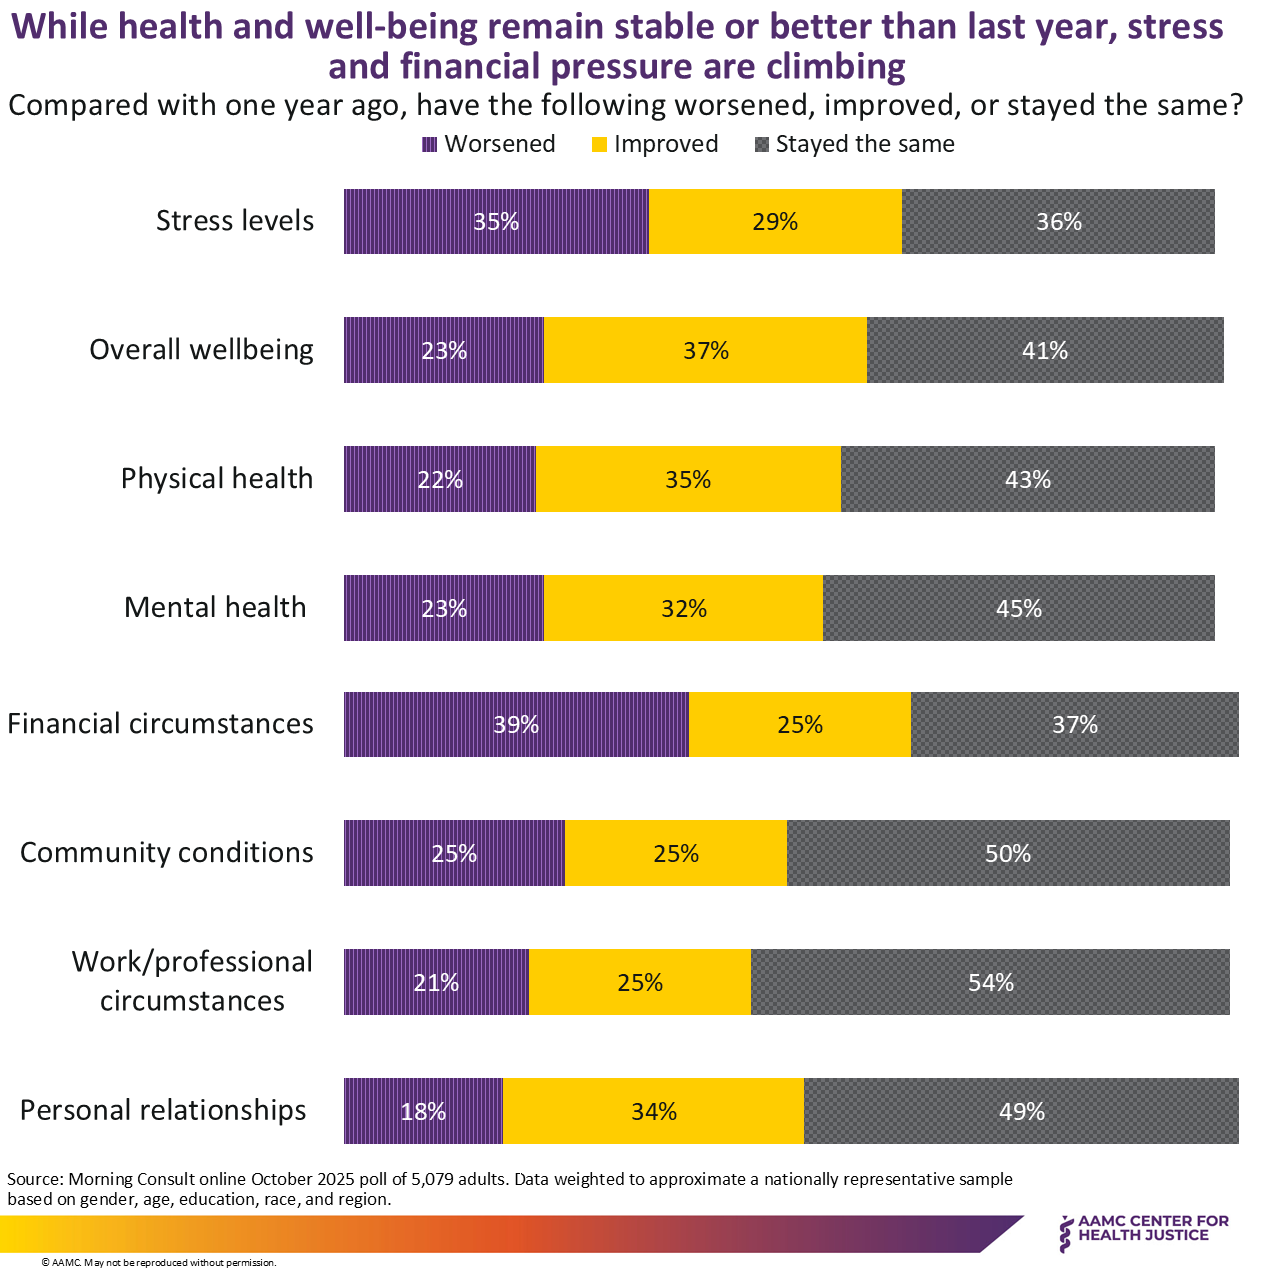
Figure 1
Presentation
While health and well-being remain stable or better than last year, stress and financial pressure are climbing. The figure contains a stacked horizontal bar graph comparing the percentage of adults who answered the question “compared with one year ago, have the following worsened, improved, or stayed the same” for eight domains: 1. stress levels, 2. overall well-being, 3. physical health, 4. mental health, 5. financial circumstances, 6. community conditions, 7. work/professional circumstances, and 8. personal relationships. Source: Morning Consult online October 2025 poll of 5,079 adults. Data weighted to approximate a nationally representative sample based on gender, age, education, race, and region.
Values
| Domain | Worsened | Improved | Stayed the same |
|---|---|---|---|
| Mental health | 23% | 32% | 45% |
| Physical health | 22% | 35% | 43% |
| Overall well-being | 23% | 37% | 41% |
| Stress levels | 35% | 29% | 36% |
Figure 2
Presentation
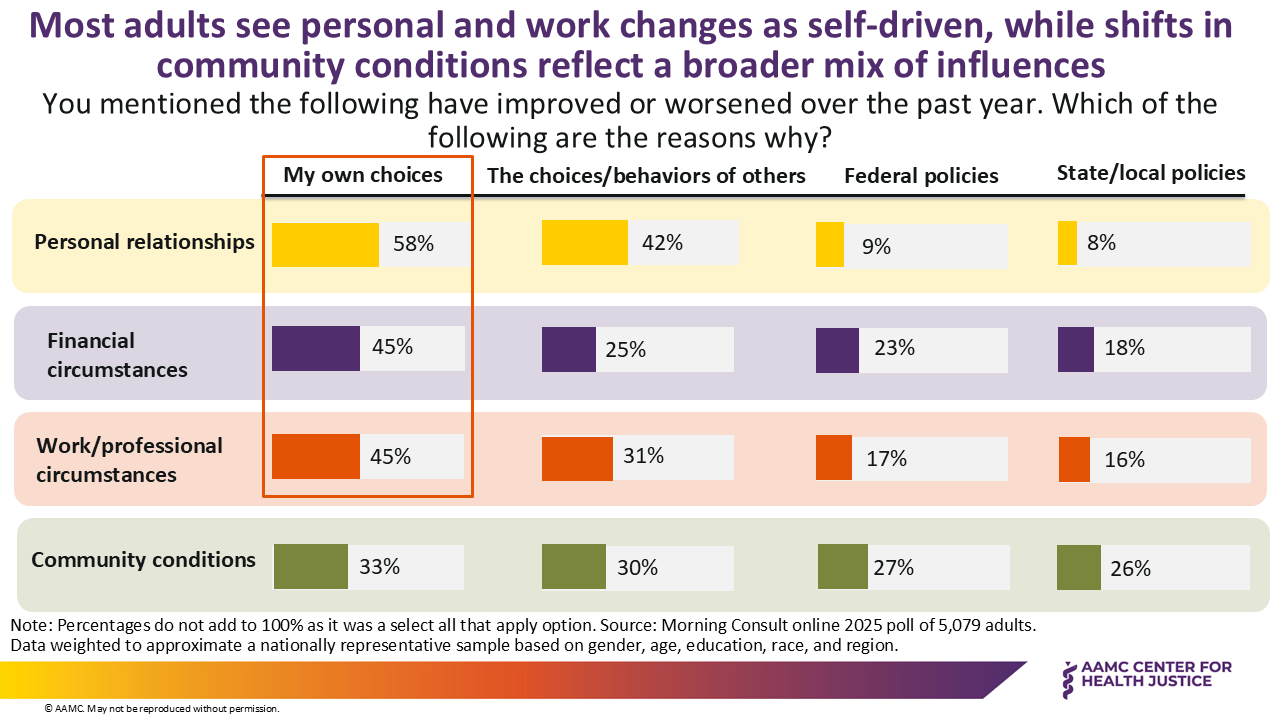
Most adults see personal and work changes as self-driven, while shifts in community conditions reflect a broader mix of influences. The figure contains a bar chart showing the percentage of adults who reported improved or worsening in 1. personal relationships; 2. financial circumstances; 3. work/professional circumstances; and 4. community conditions and whether they attribute these changes to 1. my own choices; 2. the choices/behavior of others; 3. federal policies; and/or 4. state/local policies. The highest chosen options for all situations fall under “my own choices.” Percentages do not add to 100% as it was a “select all that apply” option. Source: Morning Consult online October 2025 poll of 5,079 adults. Data weighted to approximate a nationally representative sample based on gender, age, education, race, and region.
Values
| Domain | My own choices | Choices/behavior of others | Federal policies | State/local policies |
|---|---|---|---|---|
| Personal relationships | 58% | 42% | 9% | 8% |
| Financial circumstances | 45% | 25% | 23% | 18% |
| Work/professional circumstances | 45% | 31% | 17% | 16% |
| Community conditions | 33% | 30% | 27% | 26% |
Figure 3
Presentation
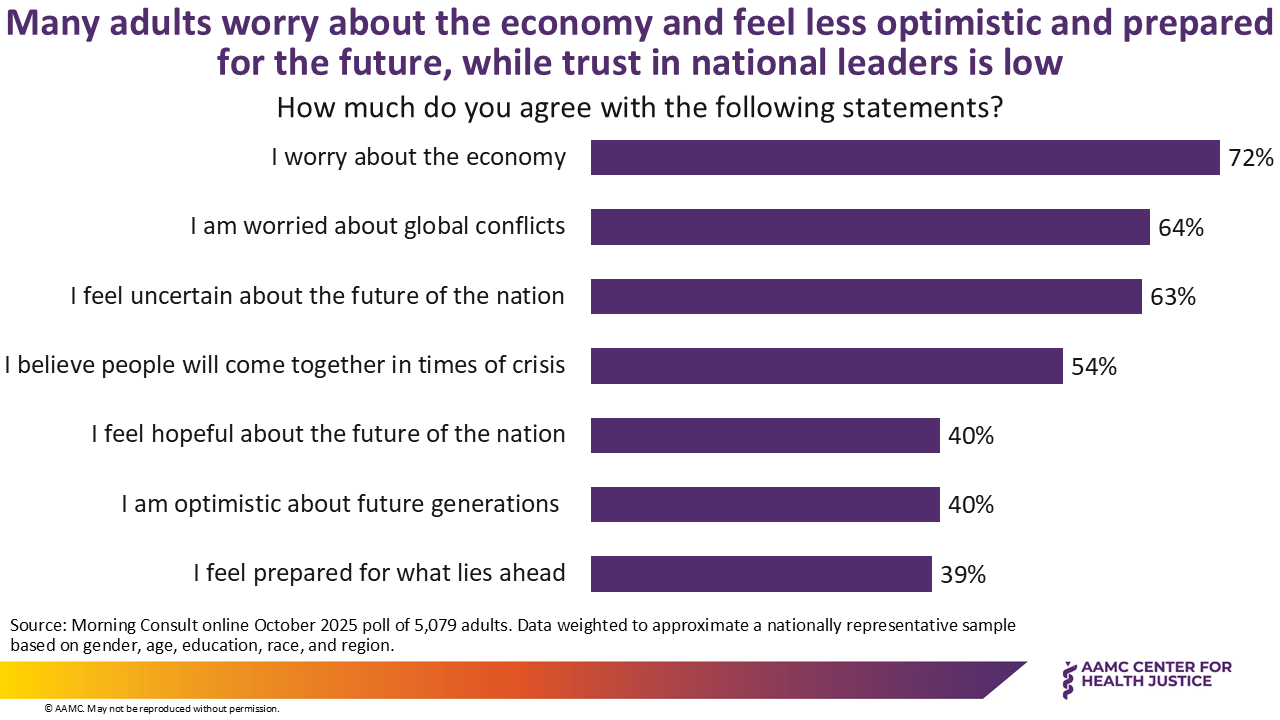
Many adults worry about the economy and feel less optimistic and prepared for the future, while trust in national leaders is low. The figure contains a bar chart showing the percentage of adults who agreed with seven statements about anxiety or hope for the future. Source: Morning Consult online October 2025 poll of 5,079 adults. Data weighted to approximate a nationally representative sample based on gender, age, education, race, and region.
Values
| Statement | Agree |
|---|---|
| I worry about the economy | 72% |
| I am worried about global conflicts | 64% |
| I feel uncertain about the future of the nation | 63% |
| I believe people will come together in times of crisis | 54% |
| I feel hopeful about the future of the nation | 40% |
| I am optimistic about future generations | 40% |
| I feel prepared for what lies ahead | 39% |
Figure 4
Presentation
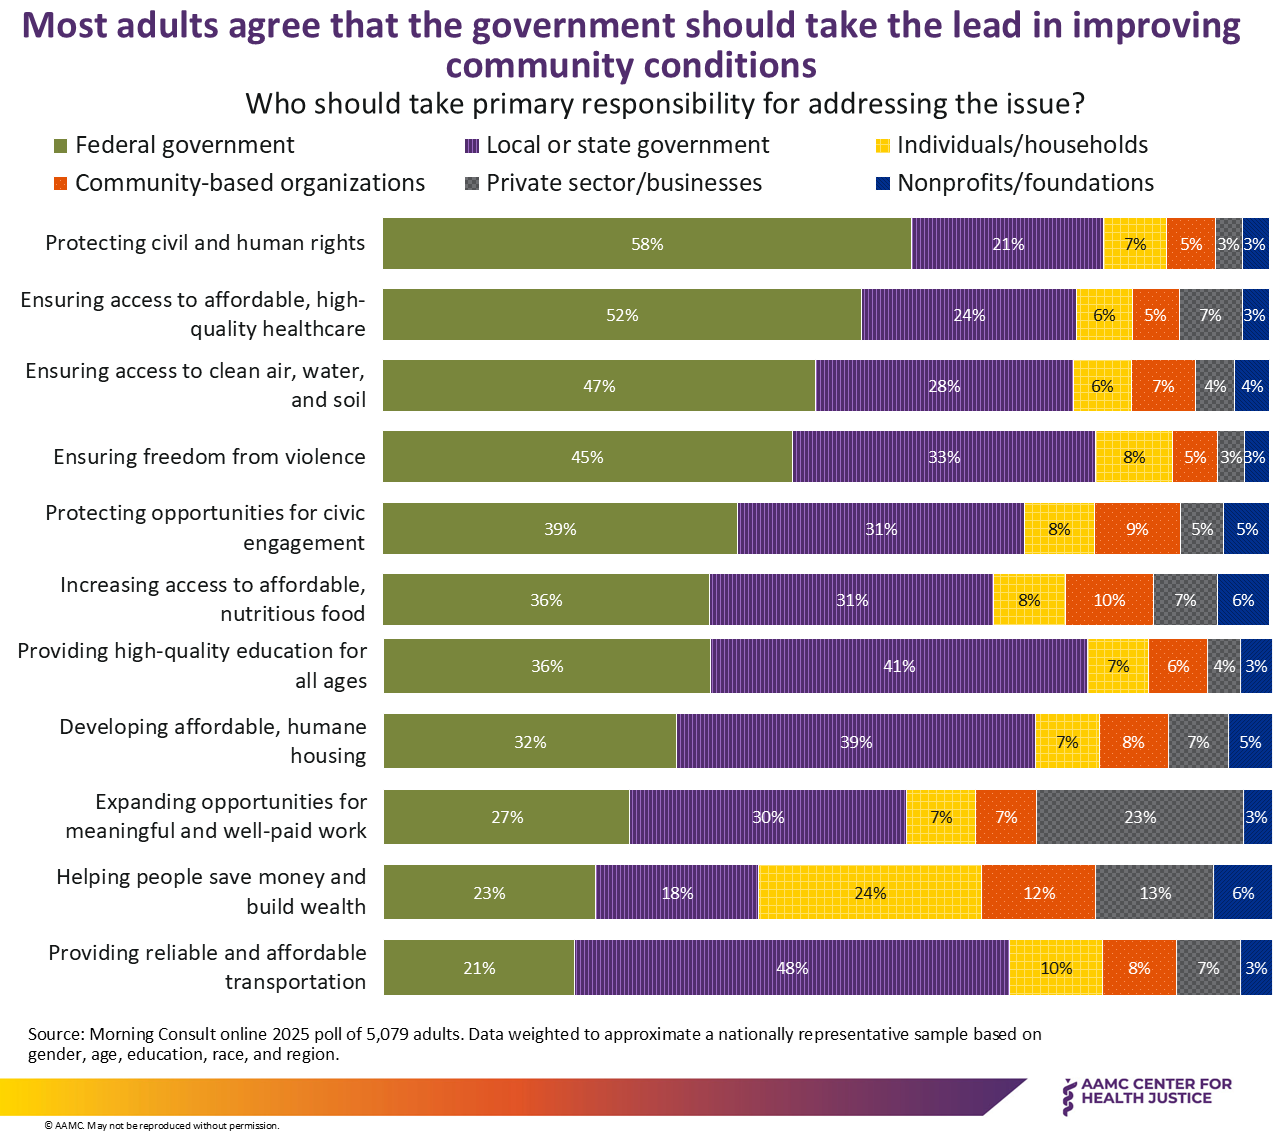
Most adults agree that the government should take the lead in improving community conditions. The figure contains a bar chart showing the percentage of adults who assigned primary responsibility for eleven vital conditions for health to 1. federal government; 2. local or state government, 3. individuals/households; 4. community-based organizations; 5. private sector/business; 6. nonprofits/foundations. The federal government featured most prominently among respondents (range: 21%-58%), followed by local or state governments (range: 18%-48%), individuals and households (range: 6%-24%), and community-based organizations (range: 5%-12%). Businesses (range: 3%-13%), as well as nonprofits or foundations (range: 3%-6%), had a smaller role to play according to the respondents, with the notable exception of “expanding the opportunities for meaningful and well-paid work,” where more than a fifth of adults surveyed (23%) identified the private sector as bearing significant responsibility. Source: Morning Consult online October 2025 poll of 5,079 adults. Data weighted to approximate a nationally representative sample based on gender, age, education, race, and region.
Values
| Vital condition | Federal government | Local/state government | Individuals/households | Community-based organizations | Private sector/businesses | Nonprofits/foundations |
|---|---|---|---|---|---|---|
| Protecting civil and human rights | 58% | 21% | 7% | 5% | 3% | 3% |
| Ensuring access to affordable, high-quality health care | 52% | 24% | 6% | 5% | 7% | 3% |
| Ensuring access to clean air, water, and soil | 47% | 28% | 6% | 7% | 4% | 4% |
| Ensuring freedom from violence | 45% | 33% | 8% | 5% | 3% | 3% |
| Protecting opportunities for civic engagement | 39% | 31% | 8% | 9% | 5% | 5% |
| Increasing access to affordable, nutritious food | 36% | 31% | 8% | 10% | 7% | 6% |
| Providing high-quality education for all ages | 36% | 41% | 7% | 6% | 4% | 3% |
| Developing affordable, humane housing | 32% | 39% | 7% | 8% | 7% | 5% |
| Expanding opportunities for meaningful and well-paid work | 27% | 30% | 7% | 7% | 23% | 3% |
| Helping people save money and build wealth | 23% | 18% | 24% | 12% | 13% | 6% |
| Providing reliable and affordable transportation | 21% | 48% | 10% | 8% | 7% | 3% |
Figure 5
Presentation
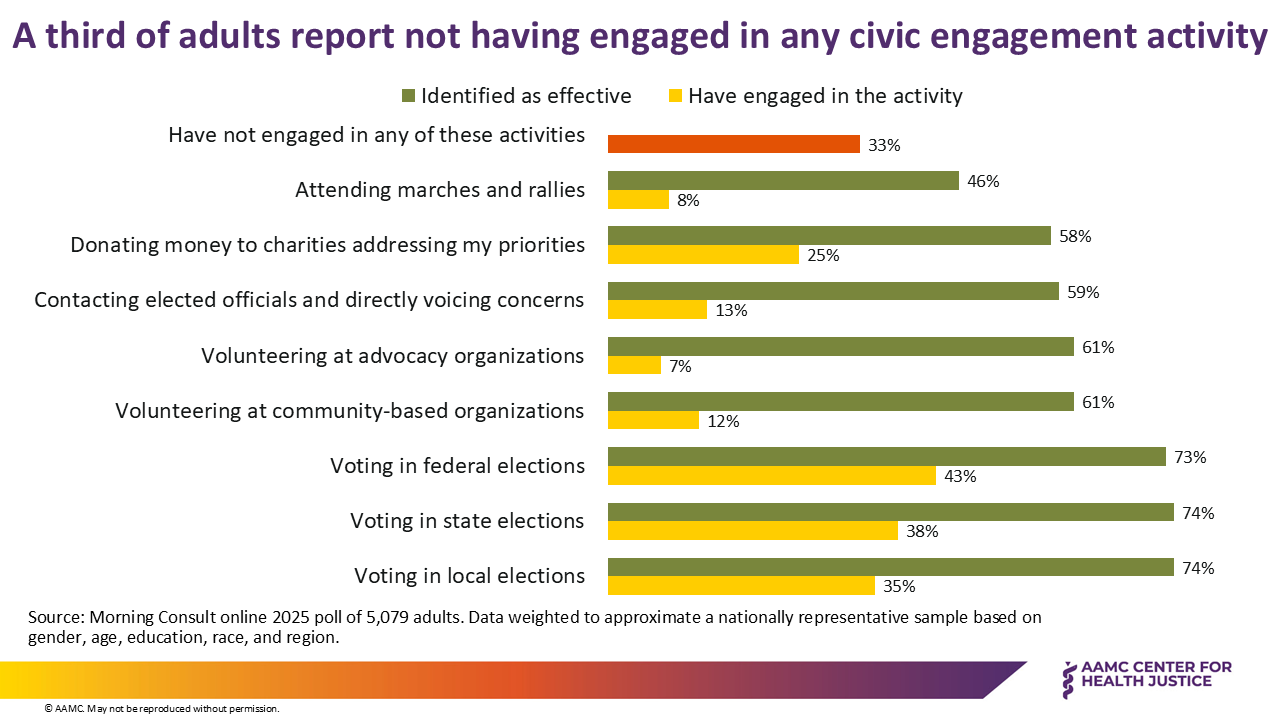
A third of adults report not having engaged in any civic engagement activity. The figure contains a bar chart showing the percentage of adults who identified eight civic engagement activities as effective, compared with the percentage of adults who have engaged in the activity. The percentage of adults who have not engaged in any of these activities is 33%. Source: Morning Consult online October 2025 poll of 5,079 adults. Data weighted to approximate a nationally representative sample based on gender, age, education, race, and region.
Values
| Activity | Have engaged in the activity | Identified as effective |
|---|---|---|
| Voting in local elections | 35% | 74% |
| Voting in state elections | 38% | 74% |
| Voting in federal elections | 43% | 73% |
| Volunteering at community-based organizations | 12% | 61% |
| Volunteering at advocacy organizations | 7% | 61% |
| Contacting elected officials and directly voicing concerns | 13% | 59% |
| Donating money to charities addressing my priorities | 25% | 58% |
| Attending marches and rallies | 8% | 46% |